Google AI Overviews is now the single biggest change to the search results page since ads arrived. The AI-generated answer box sits above everything else, it reaches billions of people, and in 2026 it increasingly hands users straight into AI Mode, Google's fully conversational search product.
For anyone who earns traffic or revenue from Google, the questions are practical. How often does the answer box appear? For which queries? Who gets cited in it? And now that ads have moved inside both AI Overviews and AI Mode, what does the commercial layer look like?
This article pulls together the verified numbers from Semrush, BrightEdge, Ahrefs, SE Ranking, Pew Research Center, Google's own disclosures and publisher-side data. Where the trackers disagree, and they disagree a lot, we say so.
Key Google AI Overviews statistics for 2026
- Semrush measured AI Overviews on 6.49% of tracked queries in January 2025, a peak of 24.61% in July 2025, and 15.69% in November 2025, across a 10 million+ keyword dataset [1]
- Semrush data reported by Press Gazette in July 2026 put AI Overviews on 47% of Google search results pages across all query types [2]
- Pew Research Center found roughly 18% of real users' Google searches produced an AI summary in March 2025 [3]
- Google says AI Overviews has 2 billion monthly users across more than 200 countries, per its Q2 2025 earnings [4]
- Google reported AI Mode passed 100 million monthly active users in the US and India by July 2025, months after its May 2025 US launch [4] [5]
- In its biggest markets, Google says AI Overviews drives an over 10% increase in Google usage for the query types that show them [5]
- BrightEdge tracked ecommerce AI Overview presence jumping from 14.4% to 20.7% in September 2025, followed by a 57% pullback in October 2025 [7]
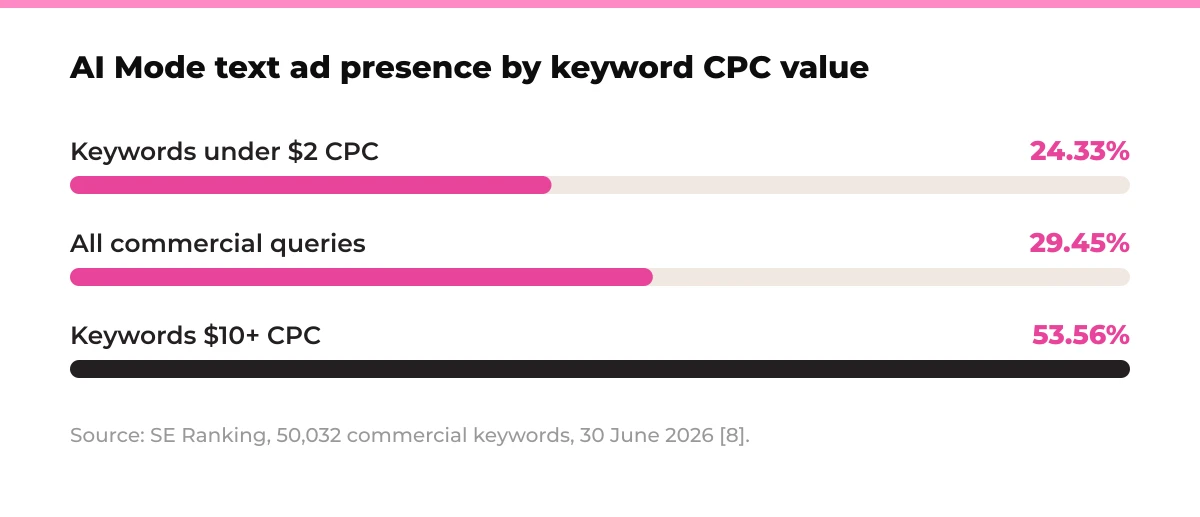
- SE Ranking found text ads on 29.45% of 50,032 commercial AI Mode queries in June 2026, ranging from 72.38% in pets to 2.64% in healthcare [8]
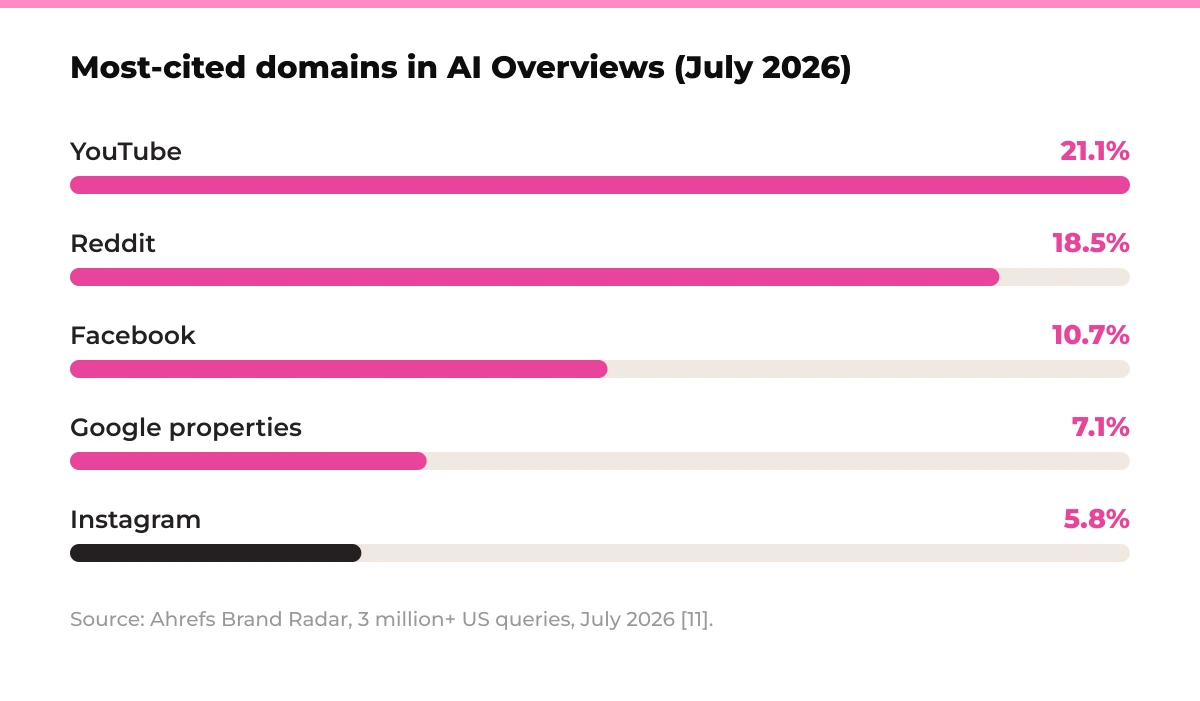
- Ahrefs measured YouTube at 21.1% and Reddit at 18.5% of AI Overview citations across 3 million+ US queries in July 2026 [11]
- BrightEdge reports 66% of URLs cited in AI Overviews do not rank in typical search results [6]
- Pew Research Center found browsing sessions ended entirely after 26% of pages with an AI summary, versus 16% without [3]
- NewzDash data via Press Gazette shows Top Stories carousels now appear inside the AI Overview on 15.5% of trending news SERPs globally, and 17.5% in the UK [2]
What share of Google searches now trigger an AI Overview?
Depending on who is measuring and when, somewhere between roughly a sixth and a half of Google searches show an AI Overview. Semrush tracked 15.69% of keywords in November 2025, whilst its 2026 data reported by Press Gazette puts the figure at 47% of results pages.
The Semrush study of more than 10 million keywords charts a volatile rollout: 6.49% of queries triggered an AI Overview in January 2025, 24.61% at the July 2025 peak, then 15.69% by November 2025 after Google trimmed coverage [1].
Pew Research Center measured real user behaviour rather than keyword panels and found about 18% of March 2025 searches produced an AI summary, with 58% of users seeing at least one that month [3].
By mid 2026 the footprint had grown considerably. Semrush data cited by Press Gazette in July 2026 put AI Overviews on 47% of all Google results pages [2]. That is broadly consistent with the direction of travel: TechCrunch noted the feature showed on only about 7% of searches in July 2024 [10].
The spread between estimates is not sloppiness, it is methodology. Keyword-panel trackers measure the terms SEOs care about, clickstream panels measure what ordinary people actually type, and the two populations are different. Treat any single trigger-rate figure as a sample of a moving target, not a census.
AI Overview trigger rate over time
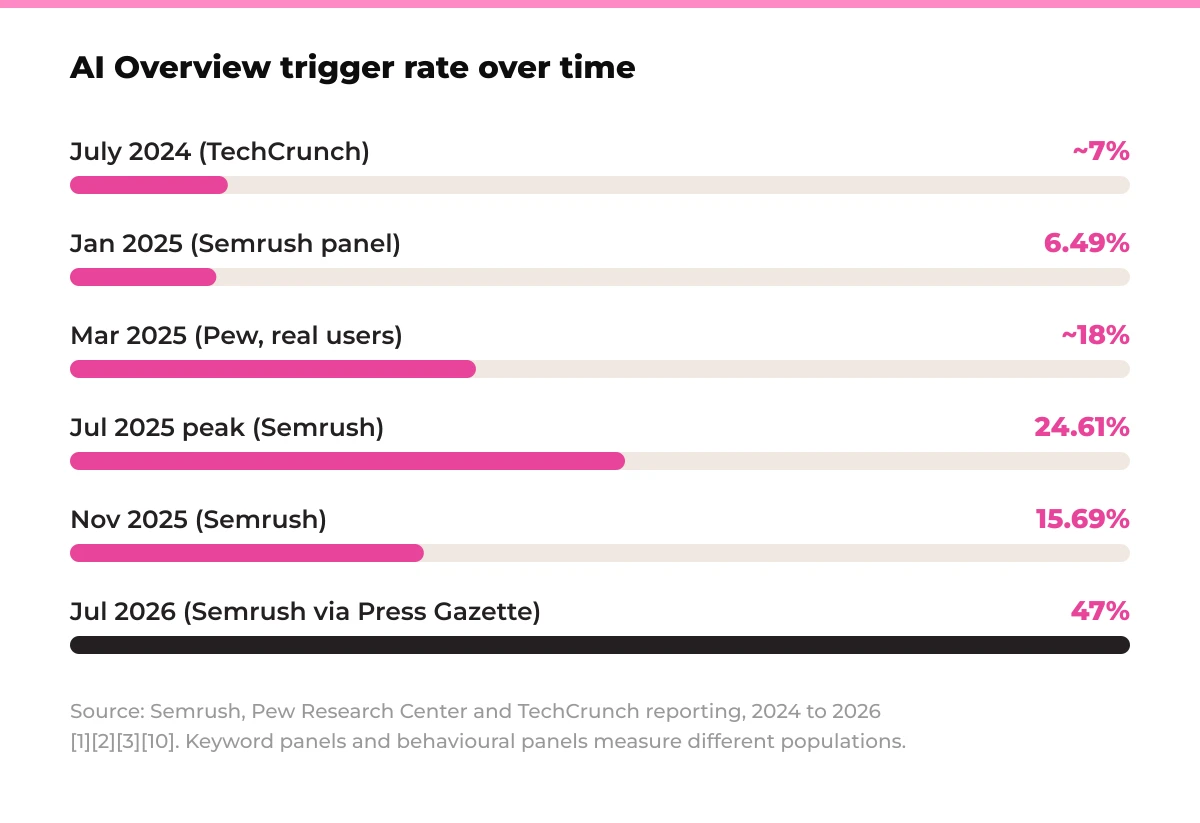
| Period | Share of queries with an AI Overview | Source |
|---|---|---|
| July 2024 | ~7% | TechCrunch reporting [10] |
| January 2025 | 6.49% (Semrush keyword panel) | Semrush [1] |
| March 2025 | ~18% of real user searches | Pew Research Center [3] |
| July 2025 | 24.61% (peak) | Semrush [1] |
| November 2025 | 15.69% | Semrush [1] |
| July 2026 | 47% of results pages | Semrush data via Press Gazette [2] |
Which query categories trigger AI Overviews most often?
Informational and scientific topics lead, but the fastest growth has been in commercial territory. Semrush found science queries topped the table at 25.96% in November 2025, whilst transactional queries grew seven-fold in a year.
By category, Semrush measured Science at 25.96%, Computers and Electronics at 17.92% and People and Society at 17.29% in November 2025, with Food and Drink the fastest riser since March at +7.25 percentage points [1].
The intent shift is the bigger story. Between October 2024 and October 2025, Semrush tracked navigational queries triggering AI Overviews rising from 0.84% to 10.33%, commercial queries from 8.15% to 18.57%, and transactional queries from 1.98% to 13.94% [1].
BrightEdge reports the same pattern qualitatively: informational queries in sectors like healthcare show a far higher incidence of AI Overviews than transactional queries in sectors like travel and dining [6].
Keywords that trigger AI Overviews also skew long and obscure. Semrush found triggering keywords averaged four to five words, and nearly 60% had monthly search volumes of 100 or fewer [1]. The answer box lives disproportionately in the long tail, which is exactly where many content sites built their traffic.
How many people actually use AI Overviews and AI Mode?
Google's own disclosed numbers are enormous. AI Overviews reached 2 billion monthly users across more than 200 countries by mid 2025, and AI Mode passed 100 million monthly active users in the US and India within months of launch.
![Statistic callout: 2 billion monthly AI Overviews users across more than 200 countries, roughly a quarter of the global internet population [4]](/assets/blog/aio-stat-2-billion-monthly-users-ai-overviews.webp "Statistic callout: 2 billion monthly AI Overviews users across more than 200 countries, roughly a quarter of the global internet population [4]")
On Alphabet's Q2 2025 earnings call, reported by TechCrunch, Sundar Pichai said AI Overviews had 2 billion monthly users, up from 1.5 billion in May 2025, and that AI Mode had passed 100 million monthly active users [4]. Ahrefs notes that 2 billion figure represents roughly a quarter of the global internet population [11].
At I/O in May 2025, Google launched AI Mode to all US users and said AI Overviews was driving an over 10% increase in Google usage for the query types that show them, in its biggest markets, the US and India [5].
The two products are converging. In January 2026 Google made Gemini 3 the default model for AI Overviews globally and began letting users jump from an AI Overview straight into an AI Mode conversation, per TechCrunch [14]. AI Mode has since gained app integrations, nearby product stock checks and side-by-side web browsing through 2026 [14].
The strategic read is simple: AI Overviews is the top of the funnel for AI Mode. Every overview now carries an invitation into a conversational session, where follow-up questions happen inside Google rather than on anyone's website.
What is happening with AI Overviews in ecommerce?
Ecommerce coverage surged, was cut back hard, and then got monetised. BrightEdge tracked ecommerce AI Overview presence jumping from 14.4% to 20.7% in September 2025, a 57% pullback in October, and shopping ads arriving inside the survivors in November.
BrightEdge describes the October 2025 refinement as highly selective: Google retained AI Overviews for 56% of tracked grocery queries but removed them from 97% of furniture queries [7].
What survived the cull was research-intent search, and that is where the ads went. By November 2025, BrightEdge observed shopping ads appearing inside AI Overviews on informational queries with commercial intent, such as "how to choose an ebike" and "how to sear a steak" [7].
For retailers the implication is uncomfortable. Google appears to be preserving AI Overviews for the research phase of shopping and then monetising that phase directly, which squeezes the organic consideration content, buying guides and comparison pages, that ecommerce SEO teams have spent a decade building.
Are there ads inside AI Overviews and AI Mode now?
Yes, and at meaningful scale. Ads reached AI Overviews on US mobile in October 2024, expanded to desktop in May 2025 alongside the announcement of ads in AI Mode, and by June 2026 nearly one in three commercial AI Mode queries showed text ads.
The timeline: TechCrunch reported ads rolling into AI Overviews for US mobile users in October 2024, drawn from existing Shopping and Search campaigns [10]. At Google Marketing Live in May 2025, Google announced it was expanding AI Overviews ads to desktop and bringing ads to AI Mode [9].
SE Ranking then measured the result. Across 50,032 commercial keywords in 20 niches collected on 30 June 2026, 29.45% of AI Mode responses showed text ads, and 71.1% of those showed two ads together [8].
Ad presence scaled with keyword value: sub-$2 CPC keywords showed ads 24.33% of the time versus 53.56% for keywords at $10 or more. The niche spread was vast, from 72.38% in pets to 2.64% in healthcare [8].
One SE Ranking finding deserves particular attention: only 11.53% of advertiser domains also appeared among the cited organic sources in the same response, and just 1.95% at exact URL level [8]. Paying to appear in AI Mode and being cited by AI Mode are almost entirely separate games, which means brands invisible to the model can simply buy their way onto the answer.
How are AI Overviews affecting news publishers?
The verified behavioural data shows AI summaries make people less likely to leave Google at all, and publishers have started litigating. Pew found sessions ended entirely on 26% of pages with an AI summary, versus 16% without.
Pew Research Center also found clicks on links inside the summaries themselves were rare, at 1% of visits [3]. The click-through collapse numbers, including Ahrefs' finding of a 34.5% lower CTR for top-ranking pages, are covered in our conversion statistics article; here the point is that a quarter of AI summary encounters end the session outright.
The legal response has begun. In September 2025, Rolling Stone owner Penske Media sued Google over AI Overviews, claiming "significant declines in clicks from Google searches since Google started rolling out AI Overviews", per TechCrunch [12].
Google is also folding news deeper into the answer box. NewzDash data reported by Press Gazette shows that in the 30 days to 28 July 2026, 15.5% of trending news SERPs with a Top Stories carousel displayed it inside the AI Overview rather than as a standalone unit, rising to 17.5% in the UK. Only the US and UK have the treatment so far [2].
Top Stories shown inside the AI Overview, by news category (July 2026)
| Category | US | UK |
|---|---|---|
| Entertainment | 35.1% | 31.5% |
| World news | 31.8% | 18.9% |
| Sports | 16.5% | 21.1% |
Source: NewzDash via Press Gazette, 17 million+ Top Stories analysed across 40+ countries [2]
How different are AI Overview sources from the organic top ten?
Very. BrightEdge reports 66% of URLs cited in AI Overviews do not rank in typical search results, and the most-cited domains list looks nothing like a classic top-ten, with YouTube and Reddit alone taking two-fifths of citations.
![Statistic callout: 66% of URLs cited in AI Overviews do not rank in typical Google search results [6]](/assets/blog/aio-stat-66-percent-cited-urls-do-not-rank.webp "Statistic callout: 66% of URLs cited in AI Overviews do not rank in typical Google search results [6]")
Ahrefs Brand Radar data across more than 3 million US queries in July 2026 puts YouTube at 21.1% of AI Overview citations, Reddit at 18.5%, Facebook at 10.7%, Google's own properties at 7.1% and Instagram at 5.8% [11]. Ahrefs' separate SERP research, updated in March 2026, found only around 38% of citations come from the top ten organic results.
Pew's user-level data points the same way: Wikipedia, YouTube and Reddit collectively made up 15% of sources cited in the AI summaries it observed, and .gov sites made up 6% of AI summary sources versus 2% of standard results [3]. BrightEdge's 66% not-ranking figure completes the picture [6].
The practical meaning is that AI Overview visibility is not a reward for ranking. Community platforms, video and official sources are structurally favoured, and a page nowhere near page one can be quoted above every organic result. Chasing position one and chasing citation are now related but distinct disciplines.
Why did Google pull AI Overviews from some health queries?
Because they were shown giving misleading medical context. In January 2026, following a Guardian investigation, Google removed AI Overviews from queries such as "what is the normal range for liver blood tests".
Per TechCrunch, the Guardian found the summaries failed to account for factors such as nationality, sex, ethnicity or age when presenting test reference ranges. Google's clinician review countered that in many instances the information "was not inaccurate" and was supported by high quality websites, but the overviews were removed anyway between 2 and 11 January 2026 [13].
Health is where the stakes of the answer box are highest. It is a category BrightEdge identifies as among the most AI Overview-saturated for informational queries [6], yet it is also where SE Ranking found the fewest AI Mode ads, at 2.64% [8]. Google is treading carefully on monetising health whilst still answering it, and selectively retreating when the press documents failures.
How to read these numbers
Trigger-rate figures come from two incompatible methods. Keyword panels (Semrush, BrightEdge, SE Ranking) track fixed keyword sets that over-represent commercially interesting terms, whilst behavioural panels (Pew) track what real people type. Neither is wrong; they measure different populations.
Trigger rates also depend on settings. BrightEdge notes AI Overviews appeared on under 15% of queries for logged-in US users during earlier phases [6], and Google adjusts coverage constantly, as the July 2025 peak and October 2025 ecommerce pullback show. A percentage without a date attached is close to meaningless.
Google's disclosed user numbers, 2 billion monthly AI Overviews users and 100 million AI Mode MAUs, are reach figures from earnings calls, not independent measurements, and "user of AI Overviews" mostly means "person who searched Google and was shown one".
Finally, the Penske claim of significant click declines is a litigation allegation, not audited data. Treat it as a signal of publisher sentiment, not a measurement.
What this means going into 2027
The answer box is the results page now. With mid-2026 estimates around 47% of SERPs and commercial intent coverage still climbing, planning for the minority of queries without an AI Overview is planning for the past [1] [2].
AI Mode is the destination Google is steering towards. The January 2026 handoff from AI Overviews into AI Mode conversations turns every summary into a doorway to a session that may never leave Google [14].
The monetisation ramp will steepen. From zero to ads on nearly a third of commercial AI Mode queries in about two years, with ad presence tracking CPC value, suggests Google will keep pushing paid placements into research-stage queries [8] [9] [10].
Citation strategy diverges from ranking strategy. With two-thirds of cited URLs not ranking conventionally and YouTube plus Reddit taking 40% of citations, presence on community and video platforms is now a visibility channel in its own right [6] [11].
Expect more selective retreats. The health-query removals and the ecommerce pullback show Google will prune the feature under scrutiny, so category-level trigger rates will stay volatile through 2027 [7] [13].
If you want a clear read on how visible your brand is inside AI Overviews and AI Mode, you can book a call with me.
Sources
- Semrush, "Semrush AI Overviews Study", December 2025. https://www.semrush.com/blog/semrush-ai-overviews-study/
- Press Gazette, "Google adds Top Stories links to many news-related AI summaries", July 2026. https://pressgazette.co.uk/platforms/google-adds-top-stories-links-to-many-news-related-ai-summaries/
- Pew Research Center, "Google users are less likely to click on links when an AI summary appears in the results", July 2025. https://www.pewresearch.org/short-reads/2025/07/21/google-users-are-less-likely-to-click-on-links-when-an-ai-summary-appears-in-the-results/
- TechCrunch, "Google's AI Overviews have 2B monthly users, AI Mode 100M in the US and India", July 2025. https://techcrunch.com/2025/07/23/googles-ai-overviews-have-2b-monthly-users-ai-mode-100m-in-the-us-and-india/
- Google, "AI Mode in Search: AI Overviews expansion and new capabilities", May 2025. https://blog.google/products/search/google-search-ai-mode-update/
- BrightEdge, "AI Overviews: A Complete Guide", 2025. https://www.brightedge.com/ai-overviews
- BrightEdge, "Shopping Ads in AI Overviews: What SEO Teams Need to Know About Google's Organic-Paid Convergence", 2025. https://www.brightedge.com/blog/shopping-ads-ai-overviews-what-seo-teams-need-know-about-googles-organic-paid-convergence
- SE Ranking, "AI Mode now shows ads on nearly 1 in 3 commercial queries", July 2026. https://seranking.com/blog/google-ai-mode-ads/
- Google, "Google Marketing Live 2025", May 2025. https://blog.google/products/ads-commerce/google-marketing-live-2025/
- TechCrunch, "Google brings ads to AI Overviews as it expands AI's role in search", October 2024. https://techcrunch.com/2024/10/03/google-brings-ads-to-ai-overviews-and-rolls-out-ai-organized-pages/
- Ahrefs, "The 50 Most-Cited Websites in Google AI Overviews (July 2026)", July 2026. https://ahrefs.com/blog/most-cited-domains-ai-overviews/
- TechCrunch, "Rolling Stone owner Penske Media sues Google over AI summaries", September 2025. https://techcrunch.com/2025/09/14/rolling-stone-owner-penske-media-sues-google-over-ai-summaries/
- TechCrunch, "Google removes AI Overviews for certain medical queries", January 2026. https://techcrunch.com/2026/01/11/google-removes-ai-overviews-for-certain-medical-queries/
- TechCrunch, "Google now lets users jump from AI Overviews into AI Mode conversations", January 2026. https://techcrunch.com/2026/01/27/google-now-lets-users-jump-from-ai-overviews-into-ai-mode-conversations/
Key facts about this post
| What this article is about | A sourced overview of Google AI Overviews statistics for 2026, covering trigger rates, query categories, reach, ecommerce, ads, publishers, citations and health-query removals |
|---|---|
| Type | Statistics / research roundup |
| Author | Tom Riley, AI SEO consultant in London |
| What AI Overviews is | Google's AI-generated answer box at the top of the results page, increasingly a doorway into the conversational AI Mode product |
| Key stat 1 | Trigger rate ranged from 6.49% (Jan 2025) to 47% of results pages by July 2026 (Semrush, Press Gazette) |
| Key stat 2 | AI Overviews reached 2 billion monthly users and AI Mode 100 million monthly actives (Google, 2025) |
| Key stat 3 | 66% of URLs cited in AI Overviews do not rank in typical search results (BrightEdge) |
| Key stat 4 | 29.45% of 50,032 commercial AI Mode queries showed text ads in June 2026 (SE Ranking) |
| Sources cited | 14 (Semrush, Press Gazette, Pew Research Center, TechCrunch, Google, BrightEdge, SE Ranking, Ahrefs) |
| Why it matters | The answer box is now the results page, citation strategy is diverging from ranking, and monetisation is climbing fast |